This week we won't comment anymore the situation on the stock markets and the US economy.
Our view is same as one week ago (see here). Short story:
- Stock markets are behaving (and soaring) under the pressure of the money-flow given or promised by FED
- Evaluations are getting higher and higher while the "real economy" is falling under the consequences of lockdowns, and of the recession we are going into.
- All the macro indicators had an unprecedented drop, and it is very unlikely they will recover quickly. Some say that stocks markets are already pricing all the above, we think they are not
- Having declared that actual prices are irrational by many points of view - we know that prices CAN stay irrational for long time, that's why we stick to our model, and we just suggest to investors to adequately dimension the sizes of their positions, because there could see a second, depper bottom
Last months' performance of the HST model
That being said, let's take a look at the recent performance of the HST model.
After all we are in a completely unprecedented times, and it would be important to find a confirmation about the fact that the HST model does outperform the market (S&P500) - or does not.
You already know that the HST model has been backtested from year 1971 (when Nasdaq index was born) to early 2019 (when the model was created).
Here is a summary of the yields provided and of the max drawdowns shown in those 49 years. (HSTv2 is using 3x leveraged ETFs, HSTv5 uses not leveraged ETFs)
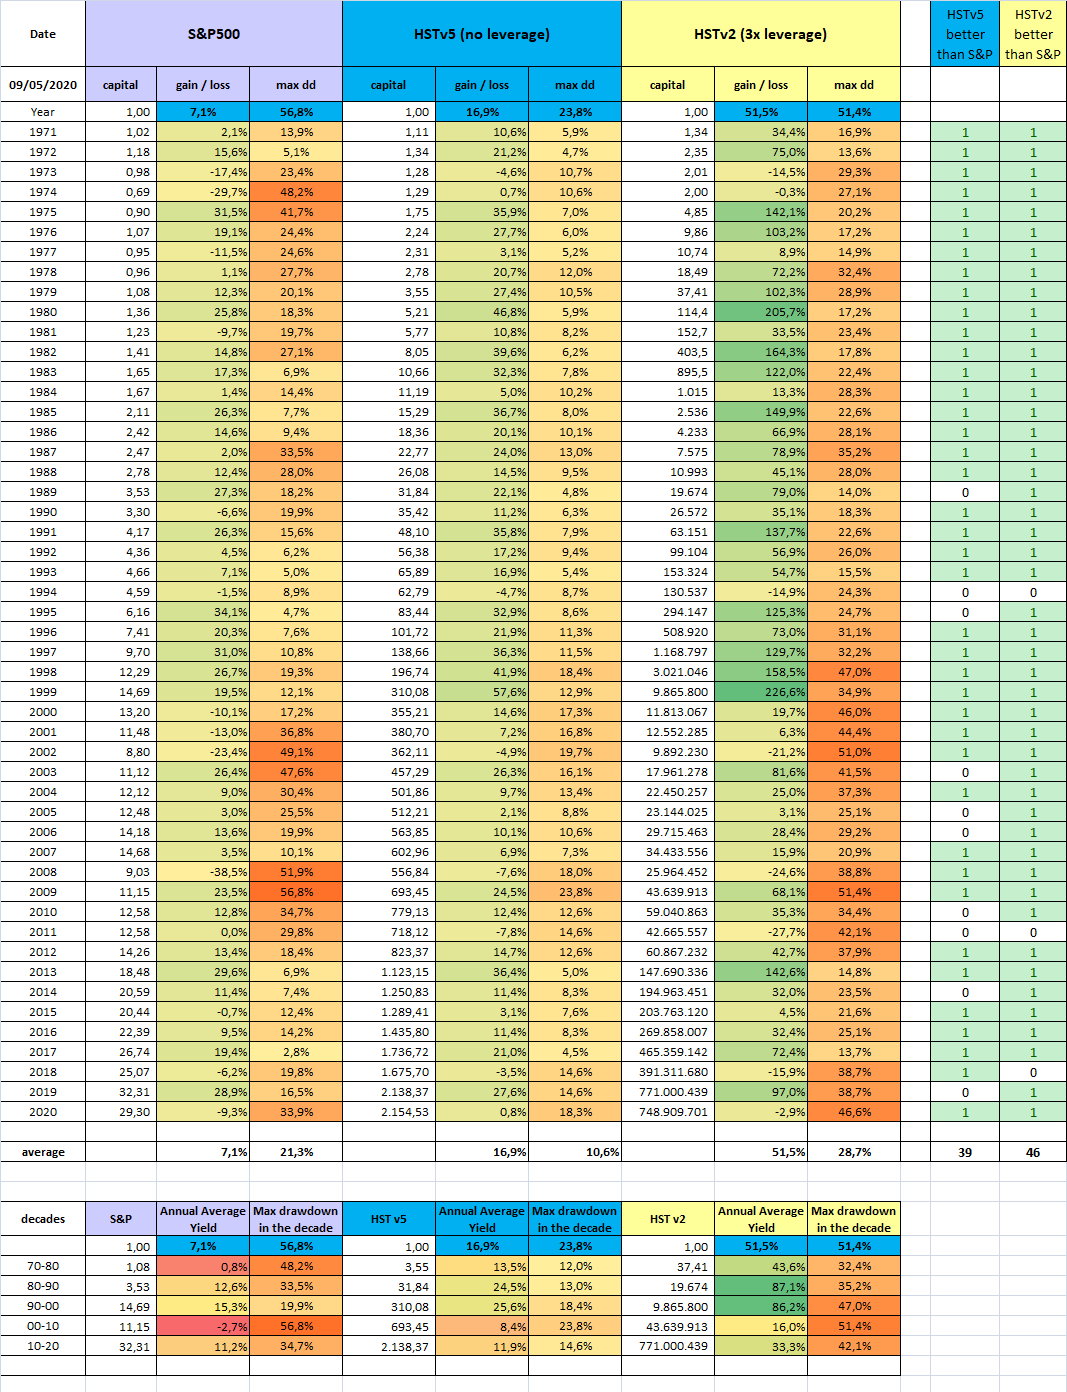
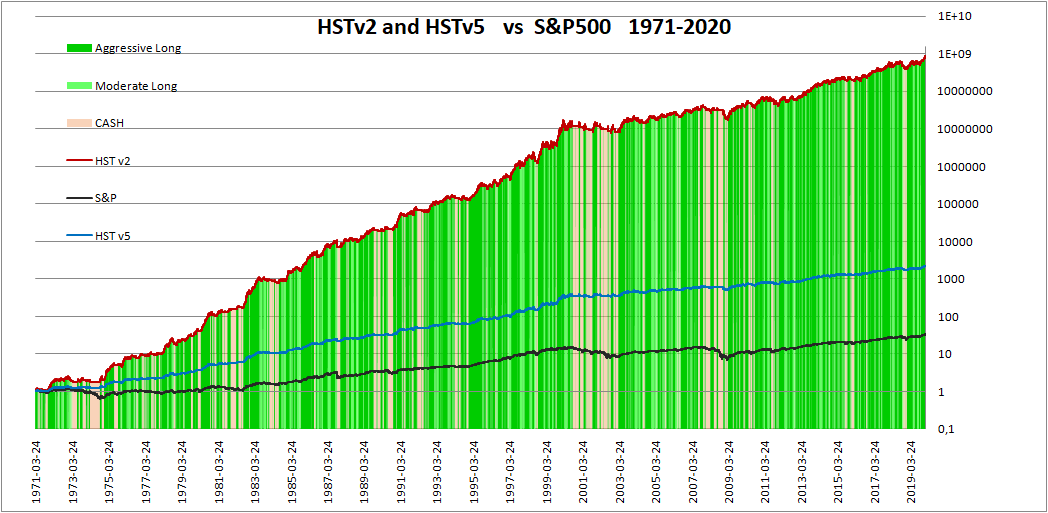
You see that - after an amazing 2019 - the HST model is suffering in 2020, but it is back to levels of early days of the year, while the banchmark (S&P500) is still -9.3% on May the 9th.
But we want to see the specific yields calculated month by month for the last 4.5 years (2016-2020), because:
- the golden years of 80s and 90s (whn the Nasdaq index ruled and grew so fast) are far behind us, and the years 2000-2013 have basically gone nowhere (for S&P, not for the HST investors).
Thus we are more interested in recent yield, than ancient ones - we have seen two really unusual drops recently (Oct-Dec 2018 and Feb-Mar 2020).
It is important to figure out if the HST model has outperformed markets also during these, unseen conditions
And here is the comparison table:
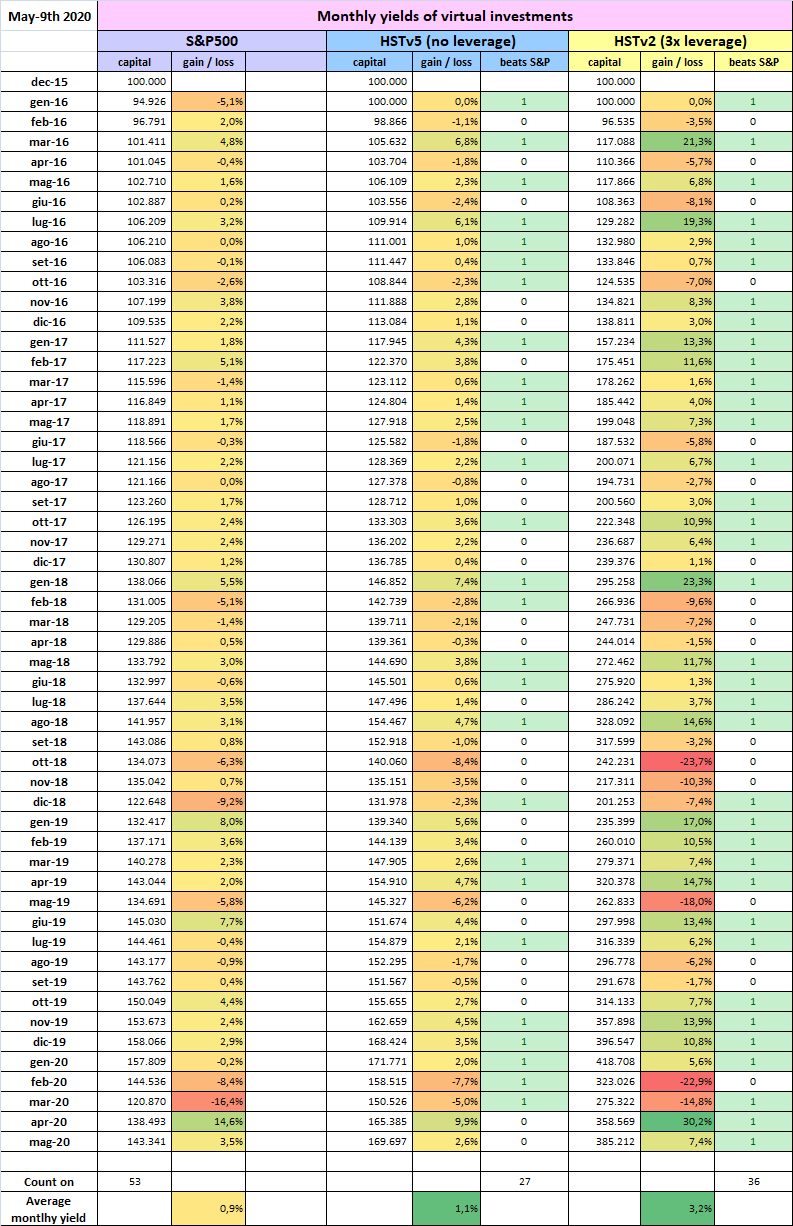
You can see that both versions of the HST model outperformed the markets during last 4.5 years, an specifically
- HSTv5 (no leverage) outperformed S&P500 in the medium term (+69.0% in 4.5 years, instead of +43.3%) and showed reduced drawdowns even in main corrections of late 2018 and early 2020
- HSTv2 (3x leverage) strongly outperformed the market (+285% in 4.5years), with larger drawdowns, recovered few time later.
This is a very significant confirmation for the validity of the HST model, even under the stress-test of the fastest drops in history.
-----------------------------------
Write to This email address is being protected from spambots. You need JavaScript enabled to view it. and get more information about daily signals from the HST model released to members.