 The HST model is an algorithm that uses Fundamental Analysis (FA) and Technical Analysis (TA)
There are two separate processes:
1- Understanding the status of the market and determining which position to assume among the 3 (using the algo of HST)
2- Investing with proper financial instruments according to the model position and individual risk management (this can be applied in different variants)
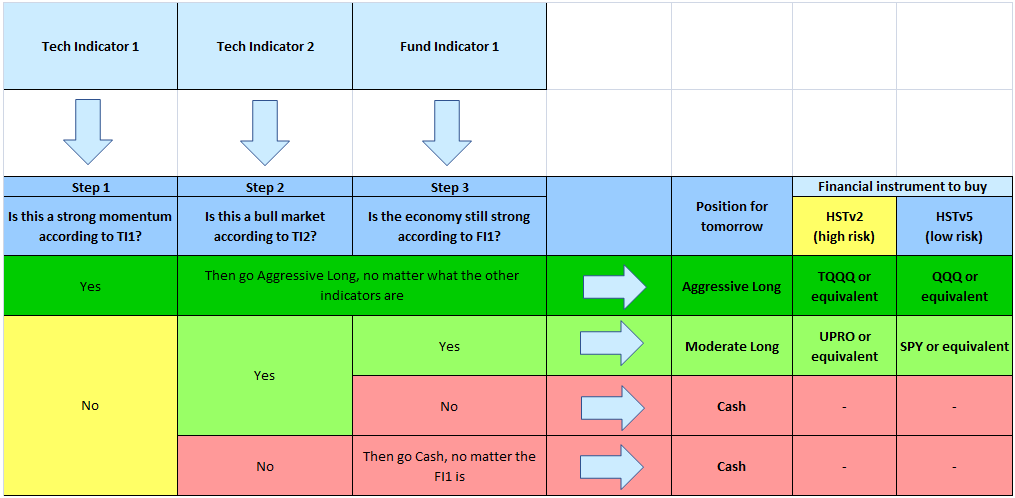
1. Understanding the status of the market using the algo of HST model
The HST model uses three separate signals. We don't reveal the maths behind them, but here is a general description of all of them:
Technical Indicator 1 (TI1)
states that the stocks market is/isn't in a very strong/bullish momentum and suggests to be 100% Long with an aggressive fund / ETF / stocks combination in Nasdaq market.
We can use $TQQQ or other similar leveraged ETFs for a very aggressive strategy (higher yields, higher drawdowns), or use $QQQ for a less aggressive strategy (lower yields, lower drawdowns).
This is a very responsive signal, shifting in and out very fast. It is based on technical underlying indicators applied to Nasdaq Index

Technical Indicator 2 (TI2)
states that the stocks market still is/isn't in a quite strong condition (during bull markets) and a main correction is not running. It suggests to be 100% Long with a less aggressive fund / ETF / stocks combination in S&P.
We can use $UPRO or other similar leveraged ETFs for a very aggressive strategy (higher yields, higher drawdowns), or use $SPY for a less aggressive strategy (lower yields, lower drawdowns).
This is a less reactive indicator, turning in and out at a slower pace. It is based on a bunch of technical underlying indicators applied to S&P Index.
It is used to mitigate the excessive reactivity of TA signal 1, which would give too many false positives, kicking the investor out of the market too soon.
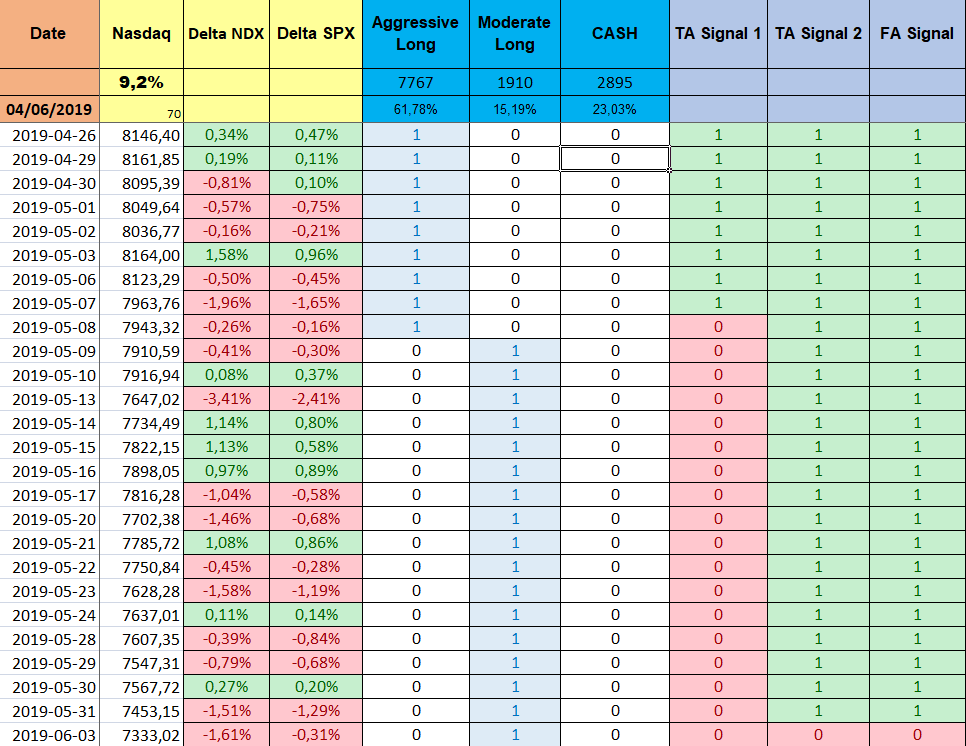
One of the more important points that can affect the yields of a trading model is the risk of underinvestment (i.e. being cash too often): since the market is more often growing that declining, it is better to be more in than out.
The HST model suggested to be cash only for 23% of the time, during the back test period (1971-now). See picture here showing 2009-2019.
Fundamental Indicator (FI1)
states that the economy is/isn't in a positive territory. The economy and the market prices go in the same direction in the long term. Usually stock prices lead the economy status. This signal is based on macro indexes applied to the US economy. This signal is mostly used to catch a good entry point, after a correction or a bear market, or to confirm that a bull market is over.
The HST algo makes a combination of the 3 signals, and it gives (every day) a signal, suggesting to be in one among 3 possible positions
- Aggressive Long (on Nasdaq)
- Moderate Long (on S&P)
- Cash
Then, how can an investor operate?
2. Investing with proper financial instruments according to the model position and individual risk management
having the positioning signal from the model, an investor has to decide what to buy (or not).
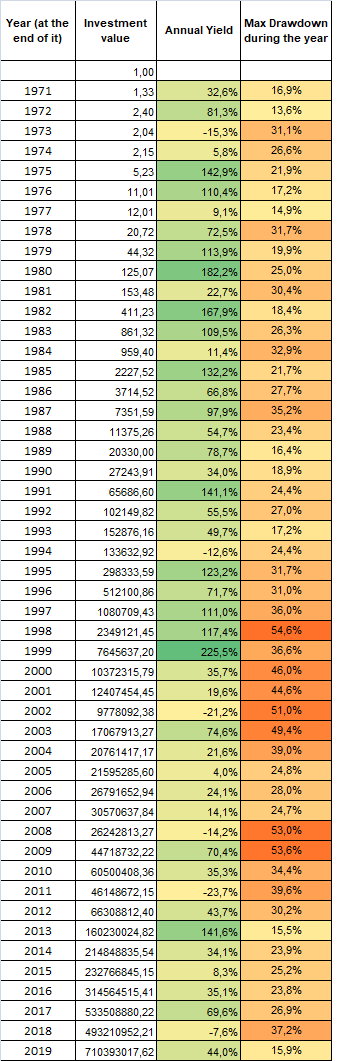
In its original design (variant 2), the HST model was applied using
- 3x leveraged ETF based on Nasdaq ($TQQQ or similar)
- 3x leveraged ETF based on S&P ($UPRO or similar)
- Cash
this is the combination which can give amazing yields (see detailed description here), but it also brings risks of main drawdowns (as -54%, happened in 1998 and other big drawdowns happened in other periods)
The HST model was designed for long-term investors, who are not worried for possible temporary drawdowns, but the psychology of the investors is complicated, and we all fear big drawdowns. In those hard moments, when your capital has been cut to a half by the market, we begin to question everything, we doubt of our model, somebody could panic.
We make mistakes in those conditions, and it is possible the someone goes to cash or re-enters the market, despite of what the model is suggesting.
So, before embarking on any risky investment, one should really focus on his/her targets in terms of expected yield and acceptable risk/volatility.
At this time, we can show two different investing strategies, both based on the HST model.
- One using 3x leveraged ETFs (variant 2)
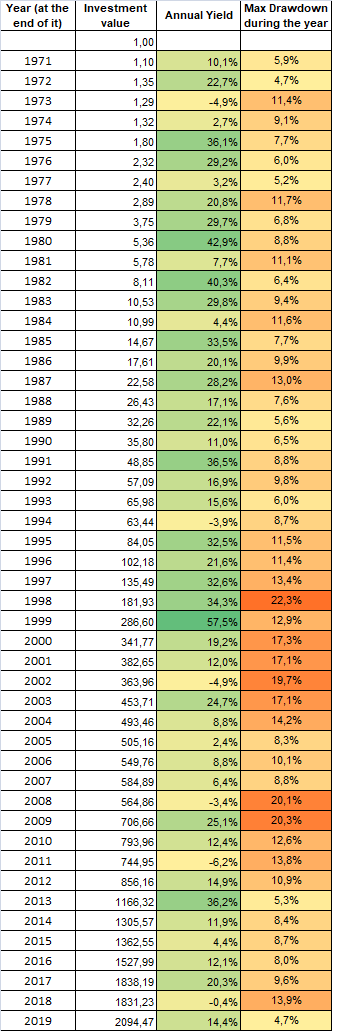
- one using non-leveraged ETFs (variant 5)
Results are good for both, with higher or lower volatility. See here for details (up to 18th May 2019)
Terms of use
A last, crucial thing to remember is the past yields and results are not a guarantee for future. We know how the HST model has worked in the past, but this is not as an ability to predict the future.
Investment is risky activity and people who decide to follow any trading model should know that they make it at their own risk, and there is a risk of big capital losses (read disclaimer here).