The last four years 2016-2019
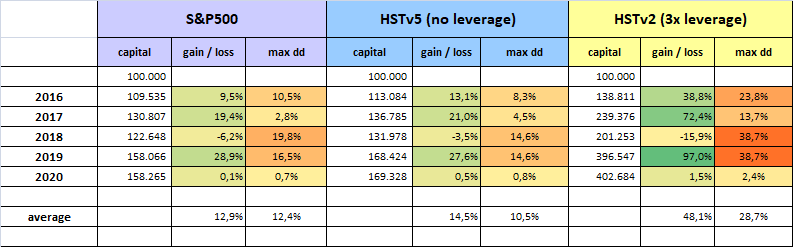
First, just look at the S&P500 column; you see, we had four very different years:
- 2016 was quite positive (S&P gained +9.5%)
- 2017 was amazing (S&P +19.4% in a straight line with no significant corrections)
- 2018 started with a small bubble of euphoria, had a drawdown in Feb, an instable growth in Q2 and Q3, an awful Q4 where it lost all the gain (-19.8% was the drawdown from previous hights), and closed with a negative S&P -6.2%
- 2019 had very positive quarters Q1 and Q4 and mixed Q2 and Q3, with a vey good annual performance of S&P +28.9%
During the last two years the short terms trends were dominated by news related to trade war between US and China, which explains a lot of the choppiness of many months.
What seemed to be really inexplicable was the hard drop suffered in 2018Q4: at that time there was no significant deterioration of the US economy to justify such a drop, and this is also proven by the "V shape" recovery and actual prices of markets. That drop was triggered by bad news about trade war.
In these four different years, we see a representative* set of samples for different market's conditions we could face in future (* with one important execption I will explain later).
So, let's analyze the response of th HST model, in its two most popular variants: HSTv5 (more conservative, no leverage) and HSTv2 (more aggressive, using 3x ETFs) in each of the four years.
HSTv5
- the average annual yield has been +14.5% instead of +12.9% of a B&H strategy on S&P. This is because the HST model mostly invests on Nasdaq index in bullish periods, instead of S&P
- the specific annual yields were (much) better in 3 of 4 years, being slightly worse only in 2019.
- The suffered drawdowns (dd) were lighter and more manageable on average
HSTv2
- the average annual yield has been +48.1% instead of +12.9% of a B&H strategy on S&P. Obvious, if you think that this variant uses 3x leverage. Still... amazing
- the specific annual yields were much better in 3 of 4 years, being worse only in 2018.
- The suffered drawdowns (dd) were bigger, in consideration of the higher risk involved with the leveraged ETFs
- given enough time to this variant, the bigger returns can cancel the fear of drawdowns: if you could earn a +97% in 2019 (as the HSTv2 did) you won't be so afraid to face a -30% in 2020.
But this is a high risk variant that HST apply only on a fraction of his assets, and remember, a +100% followed by a -30% means for the capital to go like 100 - 200 - 133
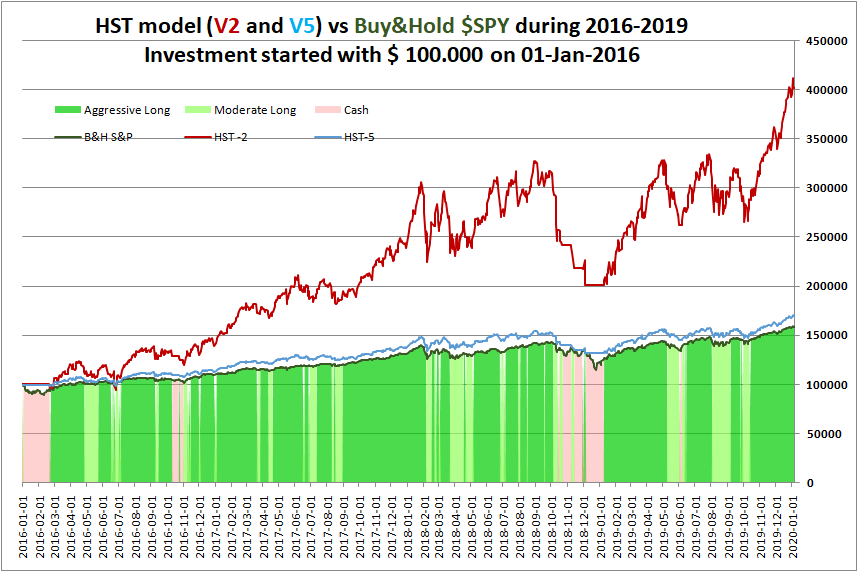
You see that the HST model has given better results, compared with a B&H strategy on the index.
But during 2016-2019 we had no recession, no bear markets like the ones of 2001-2003 or 2008. What if a bear market happens in 2020?
Let's take a look at the bigger picture, and see how the index and the HST model behave when including bear markets.
The 49 years 1971-2019
Here is the same table of the performances of S&P and the HST model (backtested)
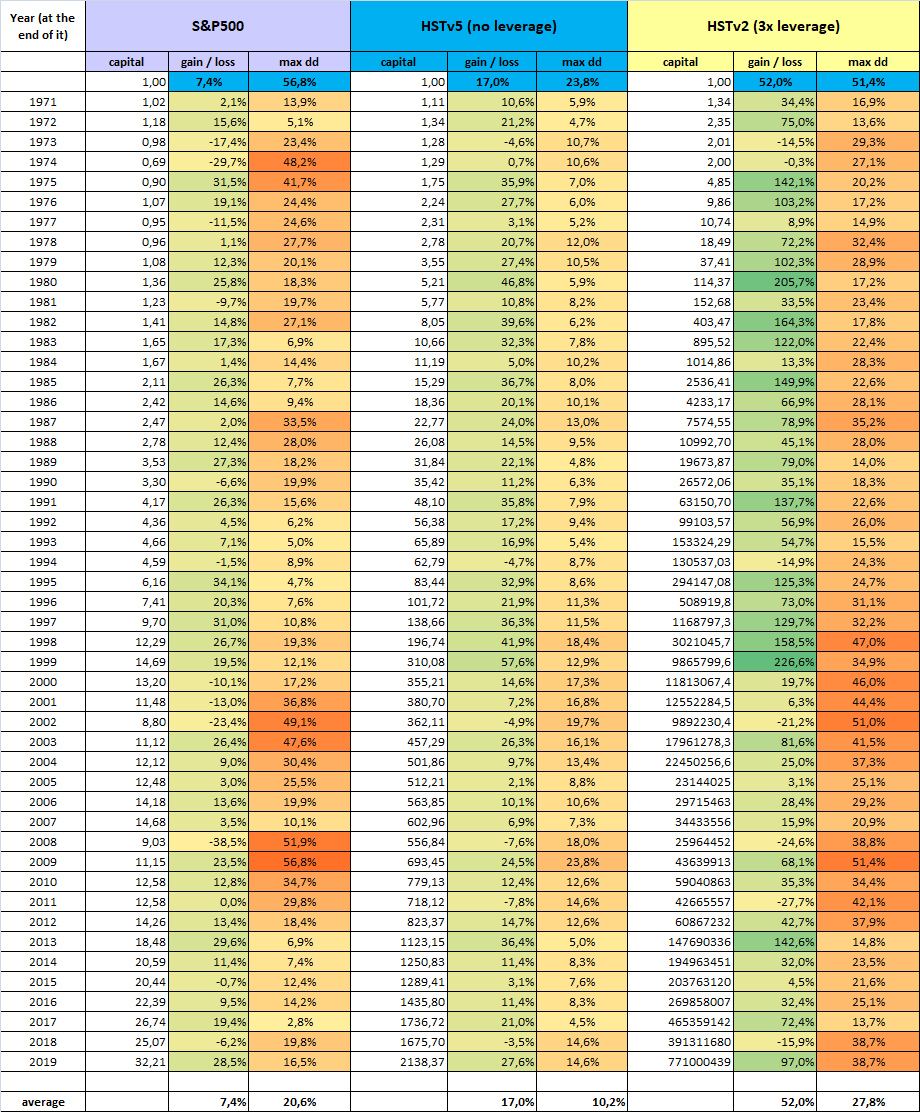
Again, let's see the S&P500 first, focus on bear markets like 1973-1974, late 80s, 2000-2002 2008:
- The S&P gained on average a +7.4% average
- but during 4 main bear markets it experienced drawdowns of -48%, -50% up to -56.8%
- the index experienced 12/49 negative years
- the average drawdown is -20.6% during the years, meaning that a -20% drawdown is absolutely normal during time
- the B&H strategy was hardly hitten by bear markets, affecting the general performance
Now, let's consider the HSTv5 model application (no leverage):
- The HSTv5 gained on average a +17.0% annual yield (more than double of S&P)
- during 4 main bear markets it experienced drawdowns of -12%, -20% up to -23.8% (less than half drawdowns of S&P)
- the average drawdown is -10.2% during the years, meaning that a -10% drawdown is absolutely normal during time
- the strategy experienced only 6/49 negative years,
- the HSTv5 strategy was slightly hitten by bear markets, not afftecting the general performance
- the HSTv5 strategy performed better than S&P for 39/49 years
The HSTv2 model application (3x leverage):
- The HSTv2 gained on average a +52.1% annual yield. We cannot compare with S&P.
[let's realize that the best years were in 70s-80s-90s, when Nadsaq was so performing. Later it has been a bit less. Still much much better than S&P] - during 4 main bear markets it experienced drawdowns of -30%, -50% up to -51.4% (these drawdowns are comparable to the B&H strategy)
- the average drawdown is -27.8% during the years, meaning that a -25% drawdown is absolutely normal during time. It is something worse that what happens to an investor applying B&H on S&P, but it is still something to consider, larger drawdowns are normal with leveraged ETFs. And there is a big risk bound to "black swan" events.
- the strategy experienced only 7/49 negative years,
- the HSTv2 strategy was hitten by bear markets, not afftecting the general performance
- the HSTv2 strategy performed better than S&P for 46/49 years
You may now understand what is the key-point making the HST model so profitable during the years:
it kicks you out to cash during bear markets, saving the capital from big drops
During years 2016-2019 there was no recession and no bear market, that's why the HST model has shown less difference with a B&H strategy.
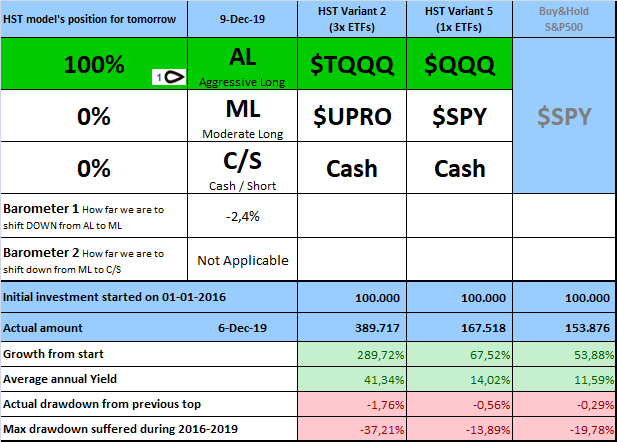
Wanna be a part of it and get daily signals from the HST model (see a sample below)?
Write an email to This email address is being protected from spambots. You need JavaScript enabled to view it.
Important: read terms of service