During the period 1971-2020 (since the time when Nasdaq index was born), financial markets have been passing through 4 main bear markets, defining “bear market” a period when S&P500 has fallen at least 30%.
We will not consider here the reasons or the triggers which cause a bear market to happen, which can be different and uniques (wars, political tensions, bubbles/speculations, lack of innovation...).
It is more important to underline that there is a typical structure of a bear market:
- Stock prices are coming from a bullish period, and valuations are typically too high (high P/E ratio)
- A trigger starts the first drop and markets suffer a drawdown If this minor drawdown ends quickly, and economy recovers from here, ther will be another leg of a bull market.
- On the contrary, if the economy worsens (this is what makes a drawdown to become a bear market), then consumers lose their jobs, and their purchasing power, worsening the US economy even more, as it is based on consumes, not on exports.
- then indexes drop much more (> 30% by definition)
- there is a short / long (depending on many factors) period of crisis, where stocks will reach low valuations, and then a new bull market can start.
How quick is the recovery depends on the rate of innovation of companies, and from the right/wrong policy of goverments
In this typical scheme, there is first stage (steps 1-2) where the economy is not hit hardly, it can succeed in recovering.
We can call these events as physiological mean reversion (stock prices drop enough to represent the actual value of companies), and they do not become real bear markets.
They happen quite often.
The HST model is designed
- to stay invested during bull markets and during these minor price corrections but
- to step aside when a real bear market is triggered (economy worsens significantly), in order to avoid the worst part of the bear market
So an investment based on HST model will face drawdowns in both situations.
If we specifically consider only the real "bear markets", the HST investor is hit by the first initial drop, and steps aside only when economy is really worsening.
When the economy will recover, it will push investors back in, not always in the perfectly right time.
Thus, it is important to see how much the HST investments, in variant 2 (with leveraged ETFs) and variant 5 (not leveraged ETFs) drop during past bear markets.
For each of the following paragraphs HST will wonder:
- “if a bear market like this one is starting tomorrow, am I ready to face it? am I ready to accept this magnitude of drawdowns without panicking ?”
- If the answer is “no”, then HST will consider to use a different strategy (passing to the not leveraged version, or reducing the size of the invested money).
HST wants to consider these questions when the situation of markets is very good, and when the recent performance of the HST virtual investments is amazing.
On February 2020, we are exactly in such period. We nned to ask to ourselves “am I ready for next bear market?”
People are extimating the chances of a bear market all the times (HST is too), but truth is that bear markets starts in a moment that noone can predict.
Secondly, at the beginning of the drop, you cannot know if it will be a real bear market, or a simple mean reversion of prices.
----------------------
In these paragraphs we will consider the 4 main bear markets of S&P500 happened in 1971-2019. We will consider
- the start of the bear market from the previous top, assuming that one investor was so unlucky to put his many in the market at the very top of the bull market
- the period of the fall, until the S&P500 touches the bottom. How much was the suffered drawdown of the index and ogf the HST model version 5 (no leverage)?
- then there is the recovery, which is actually not part of the bear market, but part of the following bull market.
But investors have a big loss in their pocket, and they might not see it as a happy period of gains, until they return to the point of their initial investment.
How long did it take for the index (and for the HST model) to recover the investment we had at the previous top?
Are we ready to face such periods in a condition of temporary loss? Can we wait so much before we recover all the money we had?
This will show the most surprising data
Note: we are considering in this article the HST model in variant 5 (no leverage), there will be another one about HST variant 2 (3x leveraged)
Bear market 1973-1980
- This bear market started in Jan-1973 and bottomed on Oct-1974, with a -48.20% drop.
- But the S&P recovered its previous top only in Jul-1980, 7.5 years after.
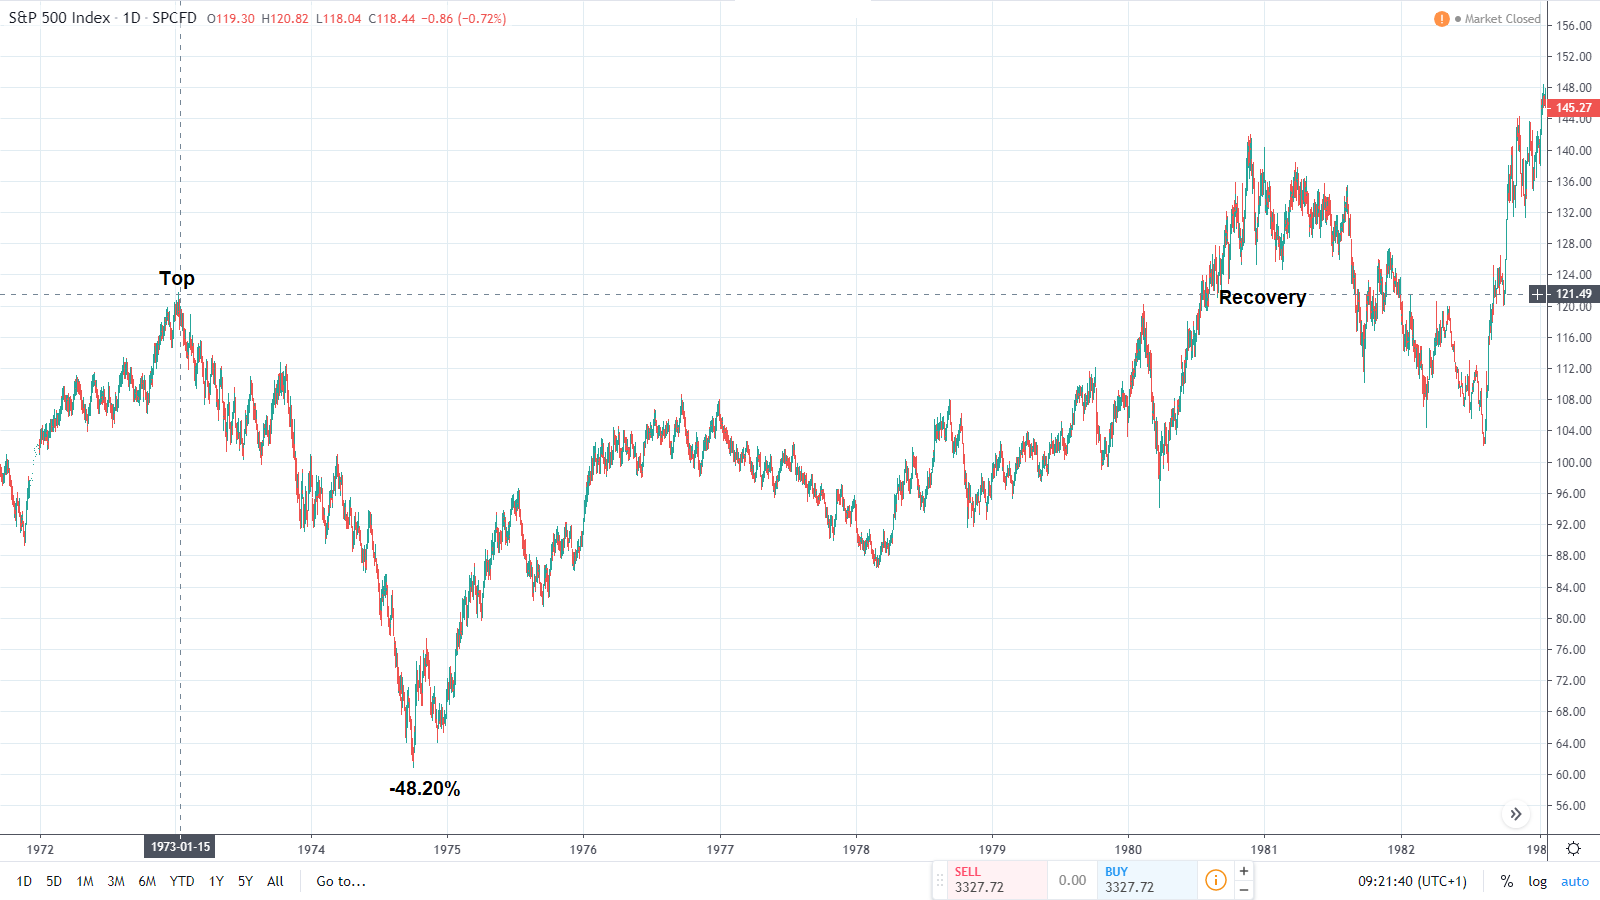
- Not to mention that this virtual money recovered after so long time, pulled back again in 1981-1982, adn were stably over the top only form 1983.
So we had TEN years when the S&P500 has gone nowhere. Ten years...
HSTv5 1973-1980
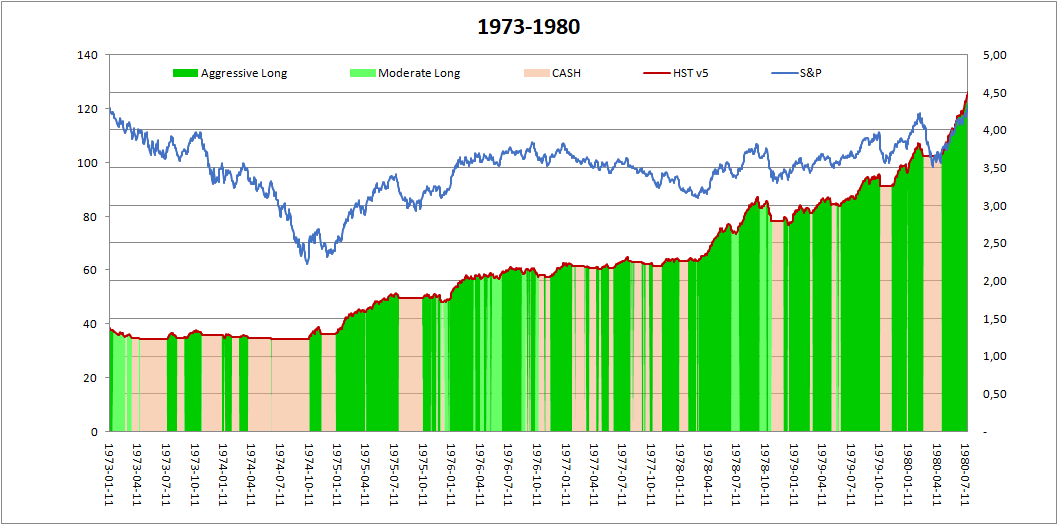
- HSTv5 during the whole period 1973-1980 suffered a max drawdown of -11.97%, because it pushed to cash quite immediately after the first drop.
- It recovered its previuos top after 1.8 years
- At the end of the period (Jul-1980), when S&P recovered its previous top (0% gain), the HSTv5 was much higher, +228%
Bear market 1987-1989
This bear market is interesting because it includes the “Black Monday” of Oct-22-1987, when S&P fell -22% in one day.
- It started in Aug-1987 and bottomed on Dec-1987, with a -33.7% drop
- The S&P recovered its previous top only in Jul-1989, 1.9 years later.
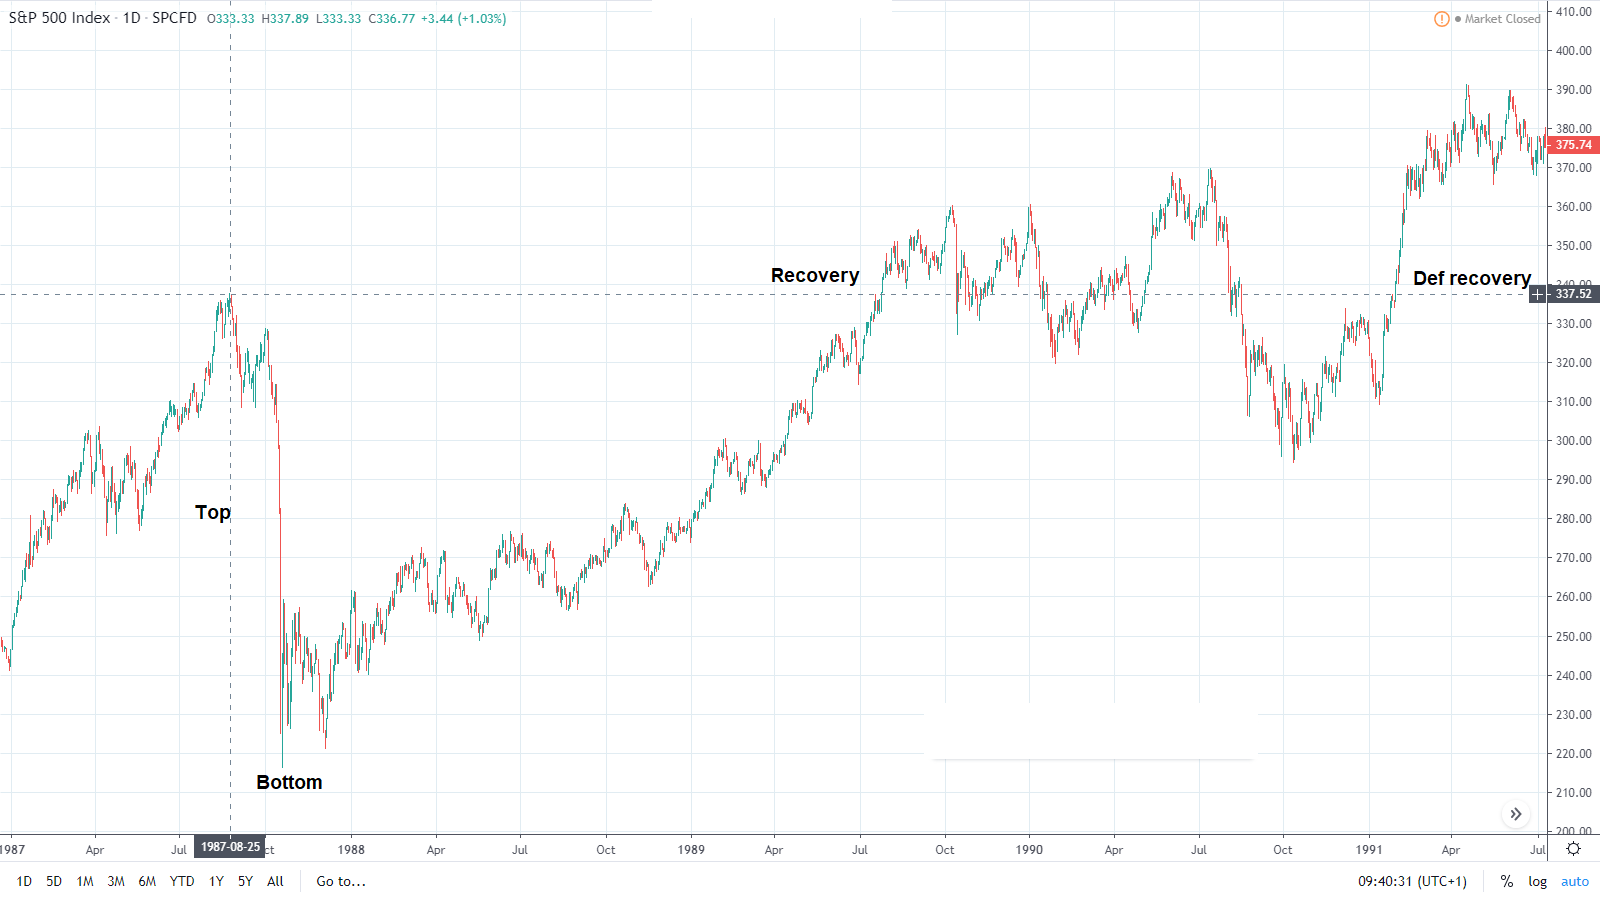
- Also in this case, the recovery was not stable until 1991, almost 4 years after the original top.
HSTv5 1987-1989
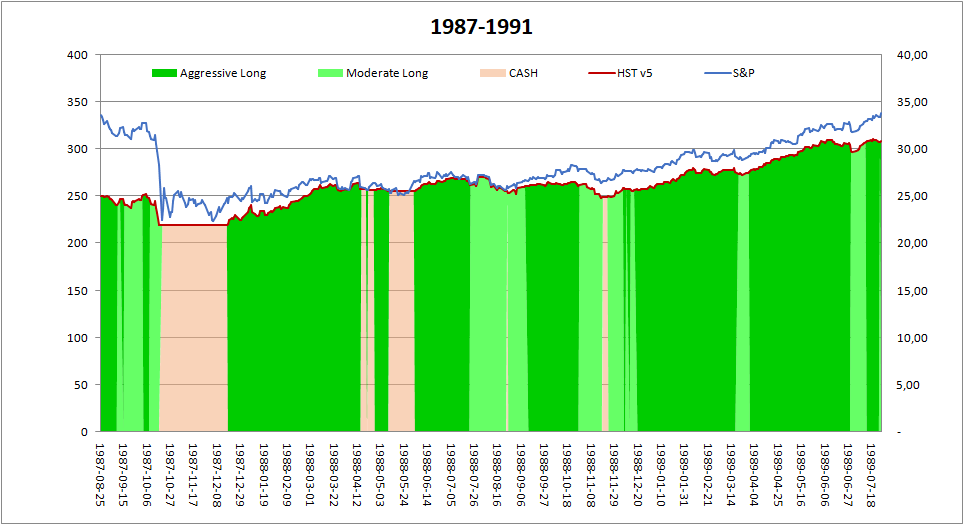
- HSTv5 during the whole period 1987-1991 suffered a max drawdown of -13.01%, because it pushed to cash quite immediately after the first drop.
- It recovered its previuos top after 0.5 years
- At the end of the period (Jul-1989), when S&P recovered its previous top (0% gain), the HSTv5 was +24%
NOTE: the HST was in CASH during the “Black monday”. But we should consider this as a lucky shot. Black swan events are the bigger danger for a stock investor, we will write a specific article about it.
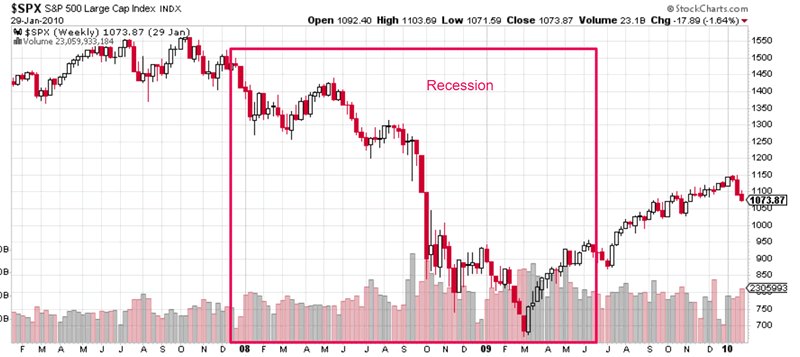
Bear markets 2000-2003 and 2007-2009
This bear market was shocking because caused by the “tech bubble”.
- The S&P market topped in Mar-2000 and bottomed on Mar-2003, with a terrible drop of -47.6%. The Nasdaq index fell even more.
- The S&P recovered its previous top only in May-2007, 7.2 years after the top.
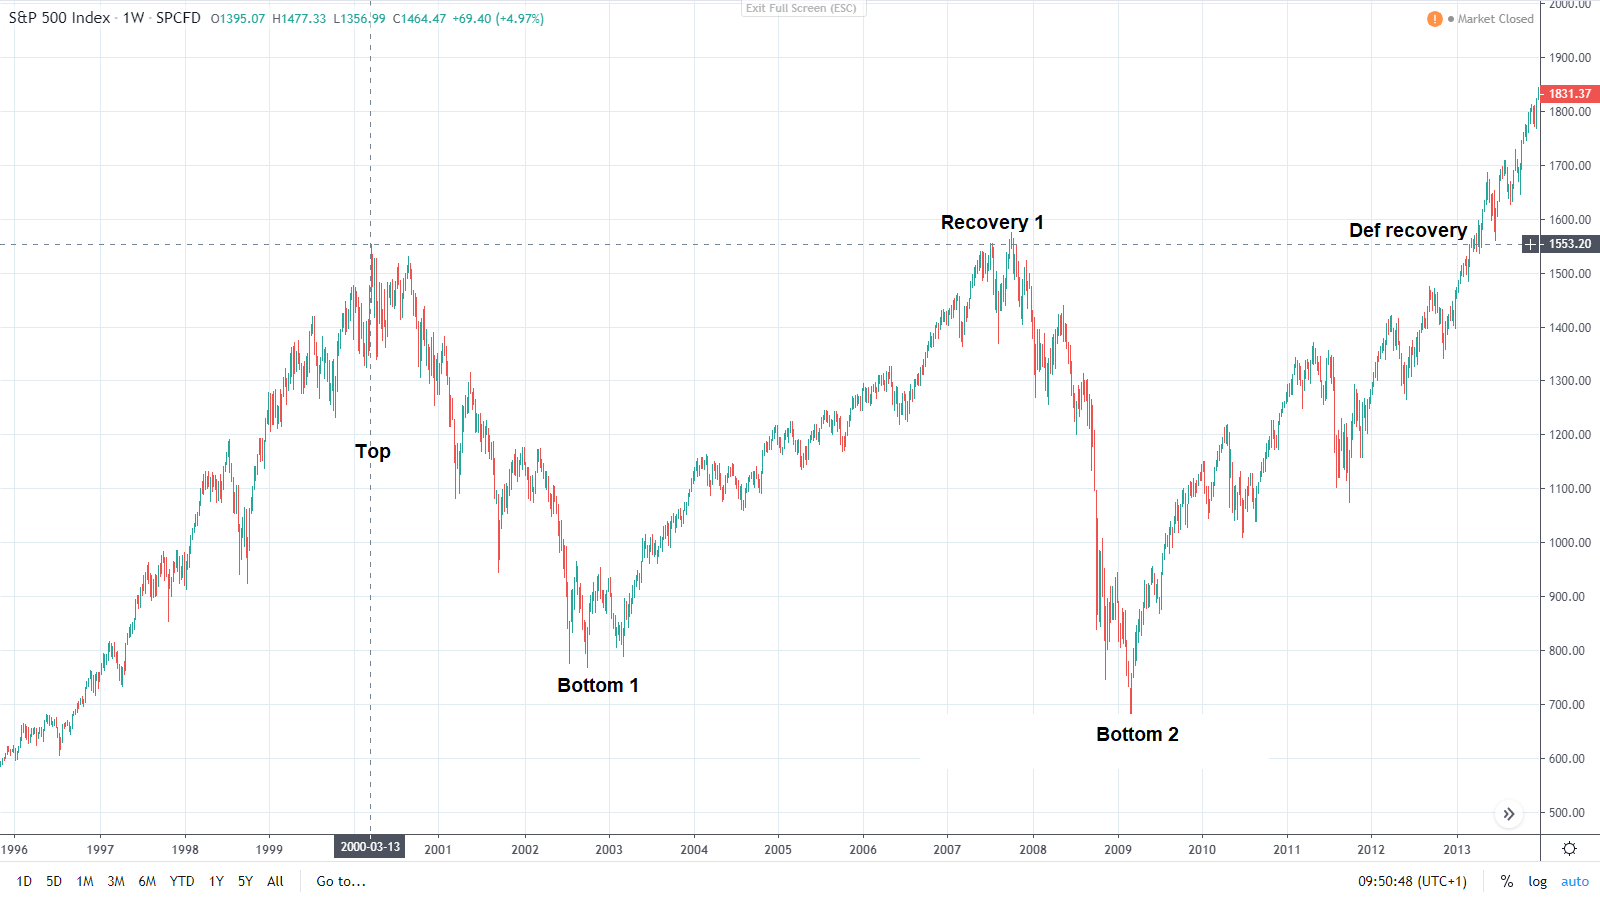
Imagine that you have invested 100.000 in March 200, and you are holding this investment, waiting for your money to grow.
You see your money cut in half in 3 awful years, and slowly recovering your 100.000 after 7 years. Probably you thing now that you would never invest in stock market anymore.
- But, just after you got your money back, another terrible bear market arrives in Oct-2007, washing out a -56.3% from the new top.
- This second bear market bottomed in Mar-2003, and recovered the ATH March 2013, 5.4 years after the temporary top of 2007.
They were been 13 years since the very start in March 2000 and yet, you have gone nowhere.
HSTv5 2000-2007
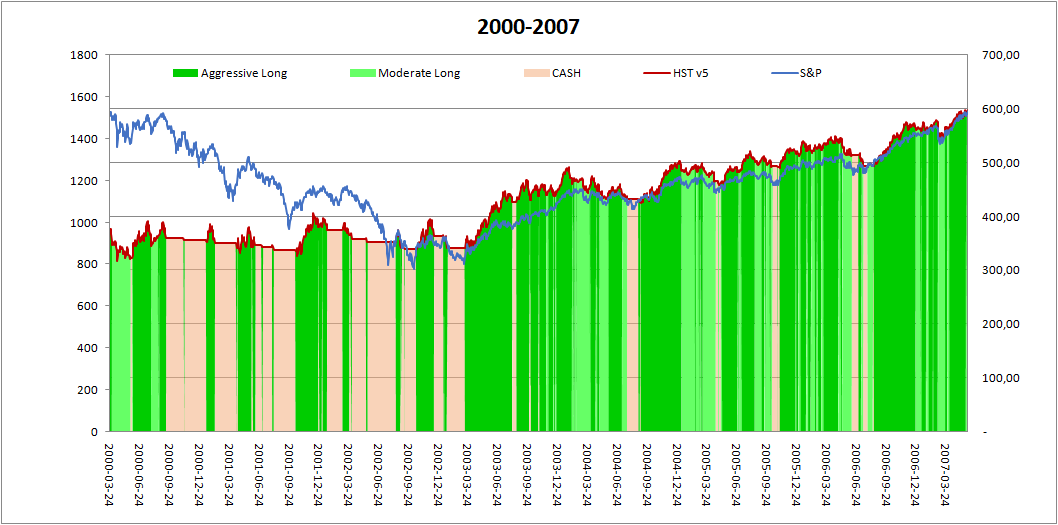
- In the first wave of the bear market started in Mar 2000, the HSTv5 suffered a max drawdown of -19.73%, because it pushed to cash quite immediately after the first drop.
- It was already recovering the previous top after 1.7 years (Dec-2001)
- At the end of the period (May-2007), when S&P recovered its previous top (0% gain), the HSTv5 was up for +59%
----
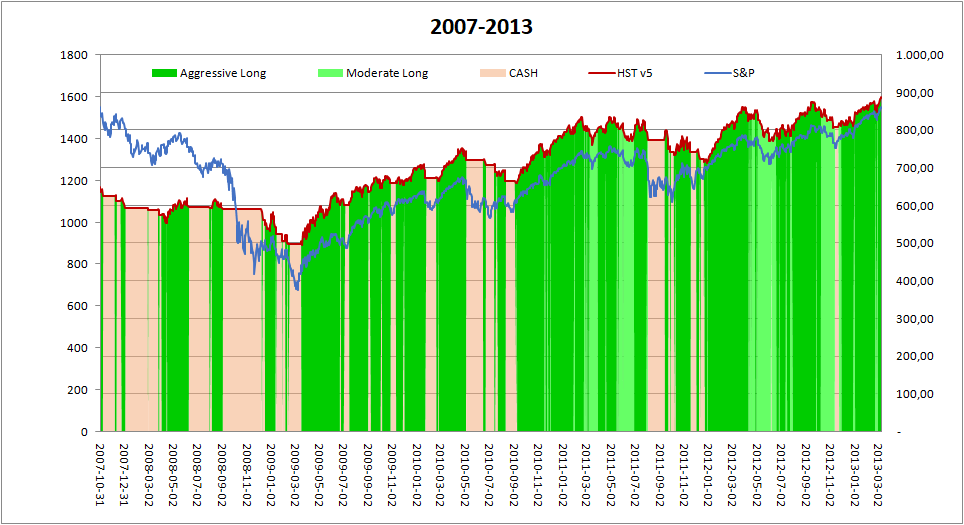
Then, in 2007, here’s the second wave of bear market
HSTv5 2007-2013
- In the second wave of the bear market started in Oct 2007, the HSTv5 suffered a max drawdown of -23.81%, staying in Cash for most days during the sharp drop.
- It was already recovering its previous top after 1.8 years (Aug-2009)
- At the end of the period (Mar-2013), when S&P recovered its previous top (0% gain), the HSTv5 was up for +37%
"Mini” Bear market 2018Q4
This is not properly a bear market (the drawdown was not exceeding -30%), but it is the most recent significant drop happened. I think it can be useful to our analysis.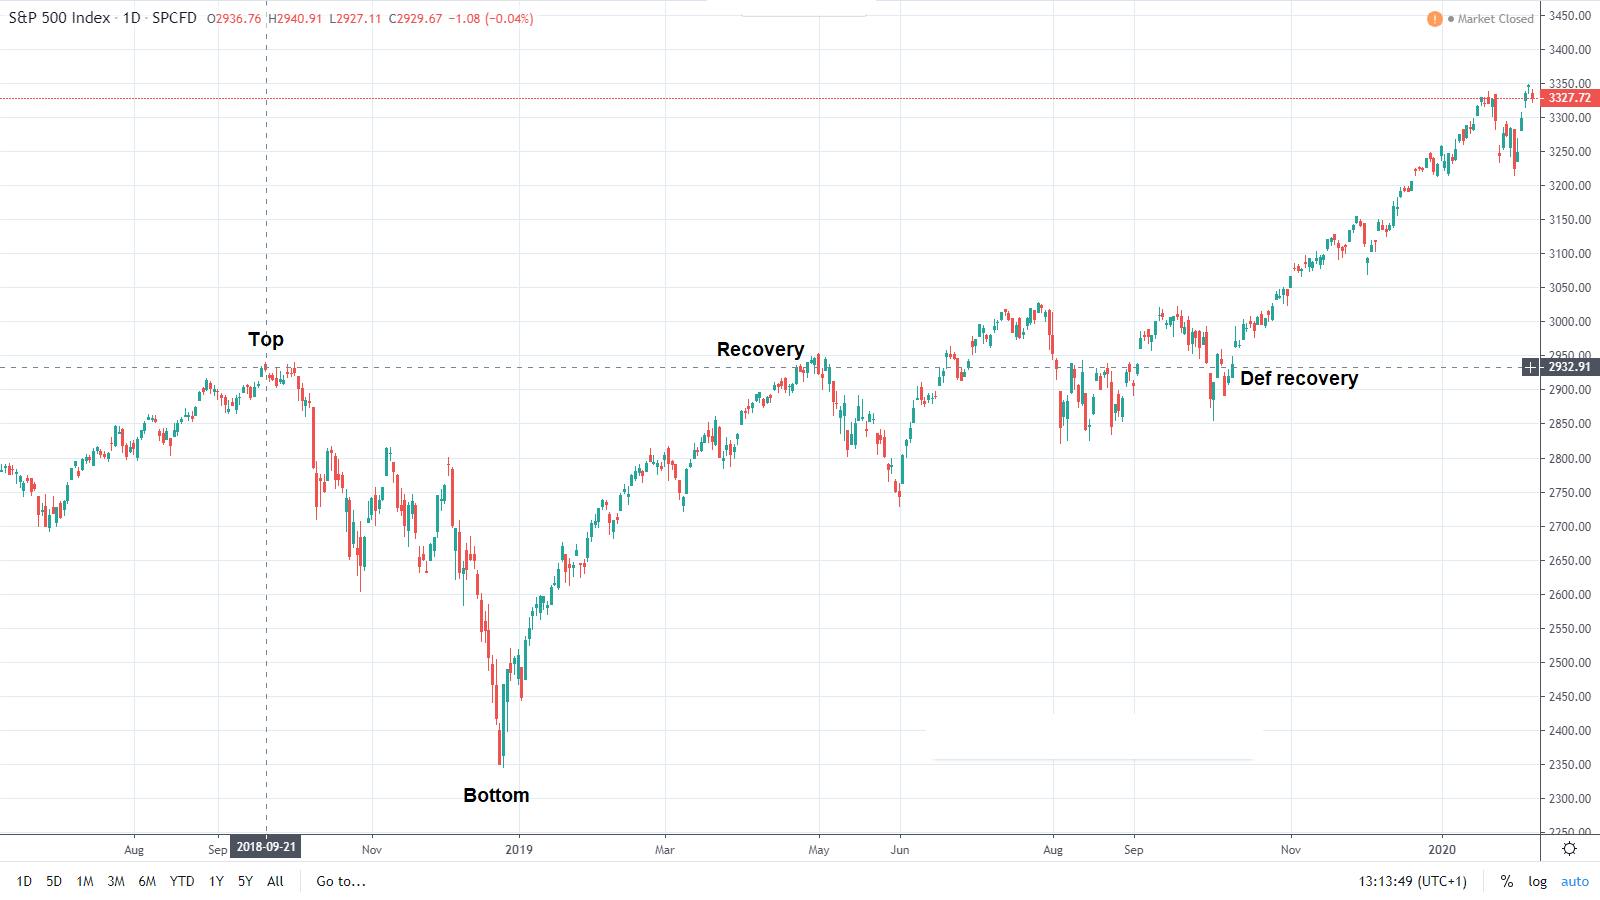
- It started in Sep-2018 and bottomed on late Dec-2018, with a sharp drop of -19.3% drop.
The S&P recovered its previous top quite soon in Mar-2019, just 3 months after bottom and 6 months after prev top.
But the recovery was just temporary, as new small drops followed. The definitive recovery was in Oct-2019, one year after the drop.
- In this case the HSTv5 suffered a max drawdown of -15.56%, staying in Cash for most days during the sharp drop.
- It has receovered in the same day that S&P did, after 3 months form bottom
- It showed a definitive recovery in the same days of S&P
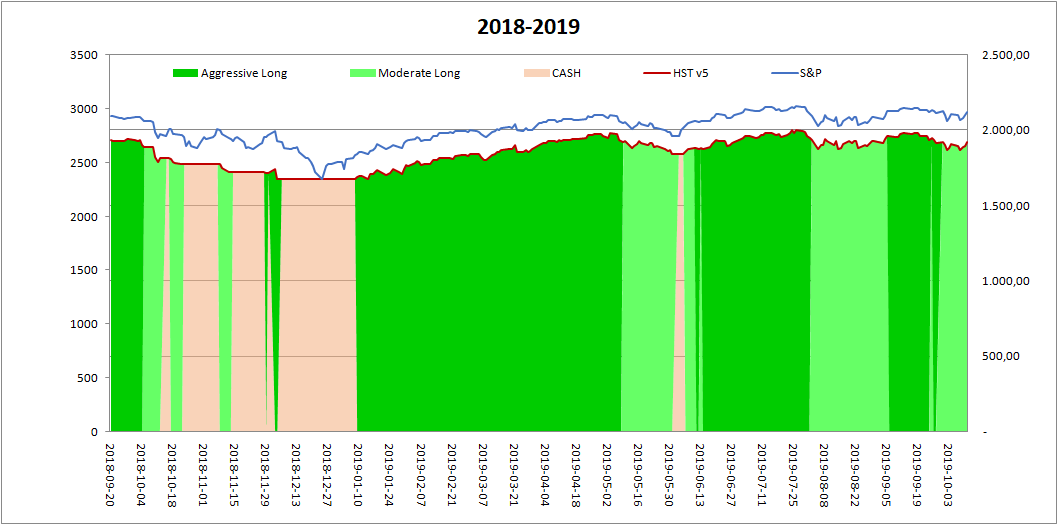
The advantages of applying the HSTv5 model haven’t been significant during this minor drop of market (see the initial paragraph of this article).
Anyway it has reduced the suffered drawdowns.
Bottom Line
Bear markets (periods when S&P drops for -30% or more) are the times when the HSTv5 model shows its amazing strength.
During the bear markets occured in the backtest period 1971-2019, the HSTv5 model
- has reduced significantly the suffered drawdowns
- has reduced significantly the time before recovering the previous tops
- has given a much better yield on average
The Variant 2 of the HST model uses leveraged ETFs, there will be a specific article about it.
In the backtest period it gave much better performance, and even shorter times to recover from losses. But it brought also bigger drawdowns.
How can I receive clean, effective signals like this below, from HST?
Subscribe to our educational service and get daily signals, writing to This email address is being protected from spambots. You need JavaScript enabled to view it..
Important note: past performance is not indicative of future results.