Can the HST model discriminate a temporary correction from a main correction or the start of a bear market?
This is a one-million dollar question, maybe more.
Truth is ....nobody knows.
Try writing the opinions of many gurus on the news, and check out one month later if/when they were right or wrong, you will discover that they are not better than flipping a coin.
The best we can do is make hypothesis, test them on long periods, and apply them on the future. This way, we have some chances to beat Buy&Hold.
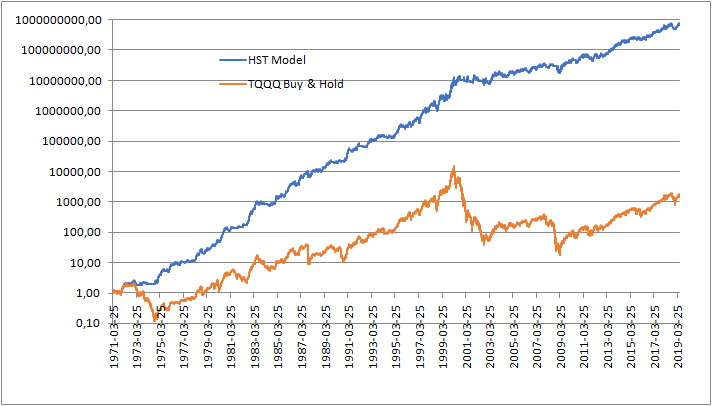
The HST model has been backtested on a huge period of 48 years, from 1971 (when the Nasdaq Composite index was born) to now, and has consistently succeeded in avoiding bear markets and big corrections, which happened in :
- 1973-1974
- 1981
- 1984
- 1986
- 1990
- 1994
- 2000-2002
- 2008
- 2011
- 2018
See the graph here: the orange line is simulating a 3x leveraged ETF based on Nasdaq (as TQQQ).
[Vertical axis is logaritmic in the first graph]
The Umbrella of HST model
 Of these these negative years the HST model gave negative performances only in
- 1973
- 1994
- 2002
- 2008
- 2011
- 2018
and losses has been completely manageable, and fully recovered few months later.
Read the article here.
Is there a crystal ball behind it? Not at all. Pure math: a mix of technical indicators and fundamental indicators.
Does the HST model avoid also minor corrections?
Sometimes it does, sometimes it doesn't. The HST model turns to cash usually when long-term technical indicators or economical indicators turn to negative.
But here is a typical behaviour of the market:
- economy is still good, no signs of bear markets or recession coming, but
- ... prices have gone up a bit too much, so
- ... a minor correction is pushing down prices to more appropriate levels
Jumping to cash every time a minor correction happens means damaging hardly the average yield of the model: there are too many false positives.
That's why the HST model is not yet bearish now (end of May 2019), when probably a correction is very close.
It will (automatically) turn to Cash, when there will be a confirmation of a high risk of bear market or main correction coming.
Still, I do not want to experience big losses, as - 40 / 50% from previous top. What can I do?
Very simple! Apply the HST model, but use non-leveraged ETFs.
The max drawdown in last 48 years was 22,3% and gave an annual average yield of 17,2% !